Reports

The Exit Strategy: Stocks Showing Critical Warning Signs

August 16, 2025

Every successful investor knows a painful truth: knowing when to sell is often more critical than knowing what to buy.

While financial media overwhelmingly focuses on buying opportunities, our research consistently identifies companies facing significant headwinds that merit serious consideration for selling. These aren’t just stocks underperforming the market; they’re businesses confronting structural challenges, deteriorating fundamentals, or carrying valuations disconnected from financial reality.

What you won’t find here: reactionary calls based on short-term price movements or headline volatility. Each company on this list has been thoroughly analyzed across multiple metrics that historically precede substantial declines.

Smart investors understand that portfolio management requires both addition and subtraction. Sometimes the best investment decision is to redeploy capital away from troubling positions before problems fully materialize in the share price.

This week’s watchlist highlights stocks showing critical weaknesses that demand immediate attention:

Target (TGT)

Target faces a deteriorating competitive position that Bank of America’s downgrade to underperform reflects through concrete operational metrics showing the retailer falling behind key competitors. The most damaging evidence is the company’s mobile app monthly active users declining year-over-year while Walmart’s grew substantially, indicating Target is losing the critical digital engagement battle that drives e-commerce growth and advertising revenue. This digital weakness undermines Target’s ability to scale higher-margin revenue streams like digital advertising and third-party marketplace fees, which are essential for offsetting gross margin pressures and funding necessary technology investments.

The company’s structural disadvantages extend beyond digital execution to fundamental cost structure issues that will intensify under the current tariff environment. With imported goods representing approximately half of Target’s cost structure compared to Walmart’s one-third exposure, Target faces disproportionate pressure from trade policy changes. Bank of America estimates Target would require price increases nearly double Walmart’s rate to offset tariff impacts, creating a competitive disadvantage that could accelerate market share losses to better-positioned rivals.

At current levels around $103, down over 22% year-to-date, Target’s valuation appears to reflect some of these challenges, but Bank of America’s $93 price target suggests further downside as competitive pressures intensify. The analyst consensus shows limited conviction with 23 hold ratings versus just 10 buy recommendations, indicating professional uncertainty about the company’s turnaround prospects. With analysts expecting a 20% year-over-year earnings decline in the upcoming quarterly report, Target appears caught in a negative cycle where digital weakness, cost structure disadvantages, and tariff exposure combine to create persistent headwinds. For investors seeking retail exposure, the combination of structural competitive disadvantages and deteriorating operational metrics suggests considering alternatives with stronger digital positioning and more favorable cost structures.

BigBear.ai (BBAI)

BigBear.ai exemplifies the dangers of investing in AI-themed companies whose business models remain unproven despite operating in favorable market conditions for artificial intelligence adoption. The defense-focused AI company’s 20.6% weekly decline following second-quarter results revealed fundamental execution problems that Wall Street expectations couldn’t anticipate. Missing revenue projections by 20% while posting losses significantly worse than expected demonstrates management’s inability to accurately forecast business performance in what should be a predictable government contracting environment.

The magnitude of BigBear.ai’s guidance revision signals deeper structural problems beyond temporary contract disruptions. Cutting full-year revenue guidance from $160-180 million down to $125-140 million represents a 22-30% reduction that suggests either poor visibility into the business or systematic overestimation of market opportunities. CEO Kevin McAleenan’s explanation of federal contract disruptions, while pointing to potential DHS funding, highlights the company’s dependence on government decision-making processes that can shift unpredictably regardless of technological capabilities.

Most concerning is BigBear.ai’s inability to capitalize on the current AI investment boom that has benefited larger technology companies and even specialized players like Palantir. Trading at a substantial premium with a $2 billion market capitalization despite deteriorating fundamentals, the stock appears to reflect speculative positioning rather than institutional conviction in the business model. The 27.97% gross margin provides some operational leverage potential, but persistent losses and revenue volatility suggest fundamental challenges in converting AI capabilities into sustainable profits. For investors seeking AI exposure, BigBear.ai’s combination of government dependency, execution challenges, and speculative valuation suggests considering more diversified technology companies with proven ability to monetize artificial intelligence capabilities across multiple market segments.

C3.ai (AI)

C3.ai represents perhaps the most concerning AI investment case, with the company’s 19% weekly decline highlighting how even bearing the AI ticker symbol cannot overcome fundamental business model failures. The preliminary quarterly results revealed not just poor performance but deteriorating trends, with revenue declining to approximately $70 million from $87.2 million the previous year while operating losses expanded to $125 million from $73 million. This combination of shrinking revenue and expanding losses during the peak of AI investment enthusiasm suggests profound structural problems that external market conditions cannot resolve.

The leadership transition adds additional uncertainty at a critical time when the company most needs strategic direction and execution focus. CEO Thomas Siebel’s announced retirement due to health issues leaves C3.ai without identified successor leadership while facing intensifying competitive pressures from better-funded technology giants. The company’s failure to generate profits after years of operation, with 12-month net losses reaching $289 million on the latest audited results, demonstrates that scale has not led to operational efficiency or sustainable unit economics.

Perhaps most damning is C3.ai’s inability to benefit from the unprecedented AI investment environment that has driven substantial growth for competitors across the technology sector. Trading at $17.87, down 90% from IPO highs, the stock reflects market recognition that compelling technology narratives cannot substitute for fundamental business viability. The 60.62% gross margin suggests the underlying technology has value, but persistent inability to convert this into profitable growth after years of market development raises questions about the addressable market size and competitive positioning. For investors attracted to AI themes, C3.ai’s track record of consistent losses during favorable market conditions suggests waiting for demonstrated profitability and revenue stability before considering investment, particularly when larger technology companies offer AI exposure with proven business models and sustainable competitive advantages.

Fed Spotlight: How Next Week’s Meeting Could Reshape Market Leadership

The Federal Reserve’s annual economic symposium in Jackson Hole, Wyoming next week represents a pivotal moment for markets attempting to broaden participation beyond the narrow leadership that has dominated 2025. With central bank officials from around the globe gathering to discuss “Labor Markets in Transition: Demographics, Productivity, and Macroeconomic Policy,” investors are positioning for potential shifts in monetary policy that could reshape sector performance dynamics.

Chair Jerome Powell’s scheduled remarks on Friday, August 22 at 10 a.m. ET will provide crucial insight into the Fed’s approach for remaining policy meetings in September, October, and December. The market’s reaction to recent rate cut speculation demonstrates how monetary policy expectations continue driving sector rotation and style performance.

Market Rotation Signals Changing Dynamics

This week’s market action illustrated the powerful impact that monetary policy expectations can have on sector leadership. The Russell 2000 surged more than 3%, posting its strongest week since May when technical analysts had predicted a potential “small cap summer” that never fully materialized.

The equal-weighted S&P 500’s outperformance relative to the market-cap weighted index signals broadening participation, while healthcare’s emergence as the week’s best-performing sector – climbing almost 5% – demonstrates how rate cut expectations can revive previously lagging areas of the market.

Healthcare’s strong performance is particularly noteworthy given its status as 2025’s laggard sector. The dramatic reversal suggests that lower interest rate expectations can quickly shift investor preferences toward sectors that have underperformed during the current market cycle.

The Small-Cap Question

Portfolio manager Brian Leonard at Keeley Gabelli Funds frames the current environment around a key question: “Will small-, mid-caps outperform large caps? We think there’s a possibility they do.”

This possibility hinges on the Federal Reserve’s policy trajectory. Small and mid-cap companies typically benefit disproportionately from lower interest rates due to their higher sensitivity to borrowing costs and domestic economic conditions. If rate cuts materialize without corresponding economic weakness or inflation concerns, the recent rotation could gain substantial momentum.

The performance divergence between large-cap growth leaders and smaller companies has reached levels that historically precede significant style rotations. An overvalued market that has again depended on a handful of major winners for 2025’s gains would benefit from broader participation across market capitalizations and sectors.

Fed Leadership Transition Adds Complexity

The monetary policy outlook faces additional complexity from the ongoing search for Powell’s successor when his term expires in May. Reports indicate 11 potential candidates are under consideration, including Jefferies Chief Market Strategist David Zervos, former Fed Governor Larry Lindsey, and BlackRock’s Rick Rieder.

Many candidates have publicly advocated for aggressive interest rate cuts, potentially reflecting the administration’s preference given President Trump’s criticism of the current Fed leadership. Trump’s escalating rhetoric toward Powell, including references to being “TOO LATE” and other pointed criticisms, underscores the political pressure facing monetary policy decisions.

This leadership uncertainty could influence Powell’s Jackson Hole remarks, as he balances immediate policy communication needs against the broader context of Fed independence and succession planning.

Policy Framework Evolution

Beyond immediate rate decisions, Powell may use the Jackson Hole platform to outline longer-term changes to the Fed’s policy framework. Wells Fargo Economics analysis suggests the Fed could abandon its current approach of allowing inflation to sometimes exceed 2% to compensate for periods below target.

Instead, the central bank may adopt “a simple 2% inflation target, where it does not try to make up for past misses.” Additional changes could include more directly linking maximum employment objectives to inflation goals, representing a significant shift in how the Fed approaches its dual mandate.

These framework adjustments could have profound implications for market expectations and asset pricing across different economic cycles.

FOMC Minutes and Internal Dynamics

Wednesday’s release of FOMC minutes will provide additional insight into internal Fed dynamics, particularly following the last meeting where two policymakers dissented in favor of lower interest rates. This represented the most significant dissent since late 1993, suggesting internal pressure for more accommodative policy.

The minutes could reveal the breadth of support for rate cuts and the specific concerns motivating dissenting members. This information will help investors gauge the likelihood of policy changes at upcoming meetings.

Corporate Earnings and Consumer Insight

Next week’s earnings calendar provides additional market-moving catalysts, with Target and Walmart reporting results that will offer crucial insight into consumer spending patterns during the critical back-to-school season. These large retailers’ commentary on consumer behavior and inventory management will supplement Fed policy discussions with fundamental economic data.

The retailers’ performance amid current economic conditions could influence Fed officials’ assessment of economic strength and appropriate policy responses.

Investment Strategy Implications

Current market dynamics suggest several potential outcomes depending on Jackson Hole developments:

Accommodative Policy Scenario: Confirmation of aggressive rate cuts could accelerate rotation toward small-caps, healthcare, and other rate-sensitive sectors. This would support broader market participation and potentially sustainable rally continuation.

Hawkish Surprise: More cautious Fed rhetoric could reverse recent sector rotation, potentially returning leadership to large-cap technology and growth stocks that have driven 2025 performance.

Framework Changes: Longer-term policy framework adjustments could alter how markets price inflation expectations and interest rate sensitivity across sectors.

Seasonal and Technical Considerations

Market positioning ahead of Jackson Hole occurs against a backdrop of historically challenging seasonal patterns. August and September typically show weaker equity performance, while ongoing tariff impact assessments add fundamental uncertainty to near-term market dynamics.

However, the combination of oversold conditions in many lagging sectors and potential policy catalyst could override seasonal headwinds if Fed communications prove sufficiently accommodative.

Key Events and Timeline

The Jackson Hole symposium runs August 21-23, with Powell’s Friday remarks representing the week’s climax. Additional economic data including housing permits, housing starts, Philadelphia Fed Index, and PMI readings will provide context for Fed policy considerations.

FOMC minutes released Wednesday will bridge the gap between past Fed deliberations and future policy signals from Jackson Hole, creating multiple opportunities for market direction shifts.

For investors, next week represents a critical juncture where monetary policy signals could either confirm the recent broadening trend or revert to narrow market leadership patterns that have characterized much of 2025. The outcome will likely depend on Powell’s ability to balance multiple competing pressures while providing markets with sufficient clarity to support continued economic expansion.

A Breakout Is Coming. And It Could Be BIG!

It’s not often the market hands you a golden opportunity. 

But that’s what you’ve got now. 

Will you take it?

I’m talking about gold itself. And I have three must-see charts to prove it to you.

First, the setup …

Late last week, the White House announced 39% tariffs on imports of gold bars.

The tariffs sparked a migration of gold from Europe to the U.S., seeking to beat the tariffs. 

That sent prices — which were already marching higher — soaring to a new high on Friday. 

That is, until the White House changed its mind. 

And gold tanked back down to support.

It won’t stay there long. 

Here are three charts showing why …

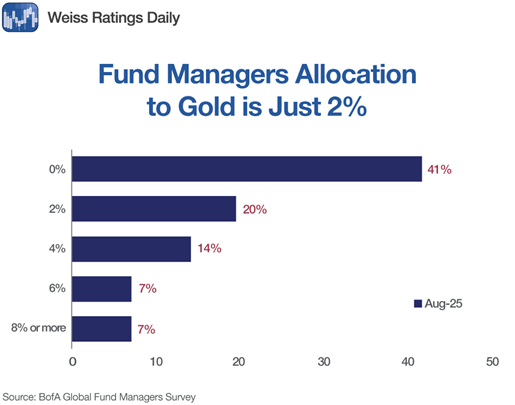
Chart No. 1: Funds Need to Buy-Buy-Buy!

Gold is enjoying strong performance and bullish market drivers.

Yet, most fund managers remain amazingly underallocated to it.

The August 2025 Bank of America survey found average portfolio exposure to gold is about 2.2%.

And a whopping 41% of fund managers have ZERO exposure to gold. 

This is even though 13% of fund managers said the yellow metal would outperform over the next five years.

And this is even though I showed you a chart last week revealing that gold DOUBLED the performance of the S&P 500 over the past year.

It sure looks like a lot of fund managers are underperforming. 

How do they fix that? Buy gold!

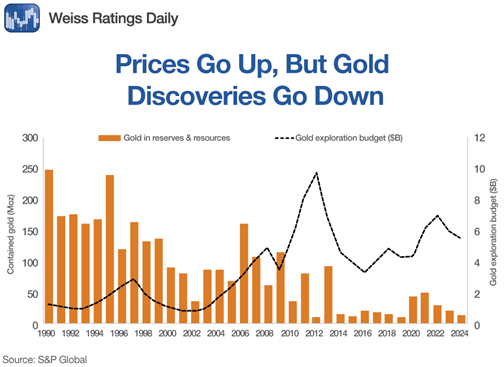
Chart No. 2: Gold Exploration Comes Up Empty-Handed

Even though gold prices broke out to new highs in 2024 — and kept going higher — gold miners have cut back on looking for gold. 

Gold exploration budgets declined 7% in 2024 to $5.4 billion, despite record-high gold prices. 

That’s down from $7 billion as recently as 2022 … and $10 billion in 2012.

That makes no sense, but it’s true! 

You can see that in the chart below …

Exploration budgets dipped last year and are way below the peak hit in 2012. 

Meanwhile, new 100,000+ gold discoveries are becoming as scarce as hen’s teeth. 

Since gold isn’t a renewable resource, total gold resources are headed down!

Market analysts say this lack of exploration spending reflects a combination of tighter financing, industry risk aversion, elevated costs and strategic shifts favoring safer investments. 

Let me translate that for you: The bean counters don’t think it’s worth their while to throw more money at gold exploration … yet.

I can’t say I really blame them. 

The last 10-year track record of success in gold exploration is TERRIBLE. 

However, I believe the bean counters will change their views as gold prices go higher.

Their alternative is to use the Scrooge McDuck levels of cash flow they’re generating to buy up small gold companies that have found worthy deposits. 

That will probably happen, too.

In any case, what happens when you have high demand for something … 

And at the same time, you have dwindling demand? 

That is resolved by higher prices. 

In gold’s case, much higher prices.

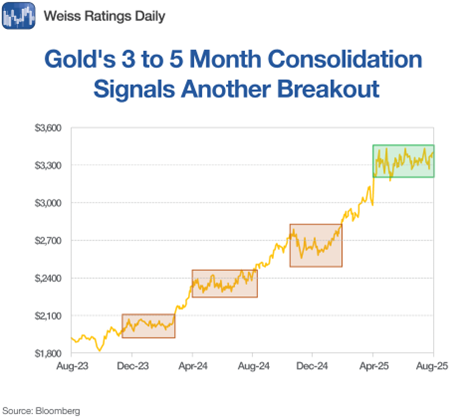
Chart No. 3: A Predictable Pattern of Profit

I listen to cycles, and there’s a very predictable pattern of gold rallies and consolidations over the past few years. 

We get three to five months of consolidation, followed by a breakout. 

Here’s a chart of that …

If the past is any guide at all, we’re near the end of the recent consolidation. 

That means a breakout is coming. And it could be BIG!

How big? 

My intermediate-term target for gold is $4,100 an ounce. 

In the longer term, I continue to target prices above $6,000 an ounce during this bull run.

That’s roughly a 20% up-move from $4,100 to $6,000.

A 20% move higher in the SPDR Gold Shares (GLD), which aims to track gold bullion prices, should be richly rewarding. 

But I expect gold miners, as tracked by the VanEck Gold Miners ETF (GDX), to make an even bigger move!

That’s because miners are leveraged to the underlying metal. 

As gold goes higher, and their mining costs remain relatively flat, their profit margins widen like the Grand Canyon.

Man, is this going to be a great ride. I hope you’re onboard for what could be a generational wealth-building event.

And now, the gold market’s zigs and zags are handing you a chance to get in on the cheap. 

Seize that chance!

If you want my absolute favorite gold (and silver) miners to play this next leg up, check this out.

All the best,

Sean Brodrick,
Analyst, Weiss Ratings

Three AI Stocks Still Trading at Attractive Levels

The artificial intelligence revolution has created tremendous wealth for investors, but it has also led to significant valuation disparities across the sector. While some AI stocks trade at eye-watering multiples, others with solid fundamentals and clear AI integration strategies are being overlooked by the market, creating compelling opportunities for patient investors.

The key to successful AI investing often lies in identifying companies that combine genuine AI capabilities with reasonable valuations. Many investors have chased the obvious winners, driving their prices to unsustainable levels, while quality companies with strong AI foundations trade at discounts to their growth potential. These mismatches rarely persist indefinitely, and astute investors can capitalize on them.

We’ve identified three AI-focused companies currently trading at attractive valuations despite having clear paths to benefit from the ongoing AI transformation across industries.

Alphabet (GOOGL) – The Undervalued AI Pioneer Trading at Magnificent Seven Lows

Despite being an AI pioneer since 2001, Alphabet finds itself in an unusual position: trading at the lowest price-to-earnings ratio among the Magnificent Seven stocks at just 21 times earnings. This discount exists because many investors believe the company has fallen behind in the generative AI race following ChatGPT’s breakthrough in 2023, causing Google Search’s market share to slip below 90% for the first time in years.

However, this pessimism appears overdone when examining Alphabet’s competitive position and financial resources. The company has committed to investing $75 billion in capital expenditures this year alone and maintains $95 billion in liquidity—providing virtually unlimited firepower to compete in the AI arms race. These resources dwarf what most competitors can deploy, suggesting Alphabet’s perceived AI disadvantage may be temporary.

More importantly, Alphabet has been systematically diversifying away from its advertising-dependent business model. Google Cloud now represents 14% of total company revenue and continues growing rapidly as enterprises adopt AI-powered cloud services. The company’s Waymo autonomous vehicle division could become a primary revenue source if self-driving technology achieves commercial success, providing another AI-driven growth avenue beyond traditional advertising.

The market’s current valuation assumes Alphabet will lose significant ground in the AI competition, but this scenario seems unlikely given the company’s technical capabilities, financial resources, and diversification efforts. At current levels around $204, investors can buy shares of an AI leader at a discount while the company undergoes its AI-driven business transformation.

SentinelOne (S) – Pure-Play AI Cybersecurity at Attractive Valuation

SentinelOne has built its entire cybersecurity platform around artificial intelligence from day one, creating a differentiated approach in the crowded cybersecurity market. The company’s Singularity XDR platform uses AI to protect endpoints, cloud workloads, Internet of Things devices, and containers—providing comprehensive coverage as businesses increasingly adopt AI technologies that expand their attack surfaces.

The cybersecurity industry presents essential infrastructure for the AI revolution, as organizations need robust protection for their AI systems and data. Grand View Research projects the cybersecurity market will expand at a 13% compound annual growth rate through 2030, but SentinelOne has been significantly outpacing this industry growth. The company reported $229 million in revenue for its fiscal first quarter ended April 30, representing 23% year-over-year growth.

While SentinelOne reported a net loss of more than $208 million in the recent quarter, the company maintains positive free cash flow of $45 million, indicating its core business generates cash despite heavy investment in growth initiatives. This cash generation capability provides financial stability while the company scales its operations and expands market share.

The current valuation appears attractive for a high-growth cybersecurity company with differentiated AI capabilities. SentinelOne trades at a price-to-sales ratio of 7, significantly below most prominent cybersecurity competitors. This discount exists partly because the company operates at a loss, but the positive free cash flow and strong revenue growth suggest the market may be undervaluing SentinelOne’s long-term potential in the AI-driven cybersecurity market.

Qualcomm (QCOM) – Diversification Strategy Paying Off Despite Market Skepticism

Qualcomm faces legitimate concerns about its smartphone chipset dominance, particularly as Apple works to reduce its dependence on Qualcomm’s products and geopolitical tensions affect its China business. However, these well-known challenges have created an opportunity to buy shares of a company successfully diversifying into high-growth AI-adjacent markets at just 16 times earnings.

The company’s strategic pivot beyond smartphones is showing measurable results. In its fiscal third quarter Internet of Things revenue surged 24% year-over-year while automotive revenue increased 21%. These growth rates significantly outpaced the 7% growth in Qualcomm’s dominant handset segment, demonstrating the company’s diversification strategy is gaining traction.

Qualcomm’s expansion into chips for IoT devices, automotive applications, PCs, and data centers positions it to benefit from AI adoption across multiple industries. These markets require the type of specialized processing capabilities that Qualcomm has developed for mobile devices, creating natural expansion opportunities as AI applications proliferate beyond smartphones.

Overall company performance remains strong despite the diversification challenges. Total revenue jumped 10% to almost $10.4 billion in fiscal Q3, while net income rose 25% to $2.7 billion as management kept cost and expense growth under control. This operational execution demonstrates Qualcomm’s ability to manage its business transition effectively while maintaining profitability.

At current levels around $157 per share, Qualcomm’s 16 times earnings multiple likely prices in the company’s known challenges while undervaluing its emerging growth opportunities. The combination of strong financial performance, successful diversification progress, and attractive valuation creates a compelling opportunity for investors willing to look beyond near-term headwinds.

Copper Market Disruption: How Trump’s 50% Tariff Is Creating Price Chaos and Investment Dilemmas

President Trump’s announcement of a 50% tariff on copper imports has sent shockwaves through global commodity markets, creating the most dramatic price disruption in the copper market since 1989. The policy has effectively split the global copper market in two, with U.S. prices surging while international markets remain pressured, forcing investors to navigate an unprecedented arbitrage opportunity fraught with both promise and peril.

Market Reaction: Historic Volatility Unleashed

The immediate market response to Trump’s copper tariff announcement demonstrates the policy’s disruptive power. U.S. Comex futures jumped following the announcement, while session delivered a staggering 13% surge – the best single-day performance since 1989.

This explosive price action contrasts sharply with international markets, where three-month benchmark copper futures on the London Metal Exchange declined over two days before recovering modestly. The widening premium between U.S. and global copper prices reflects a fundamental market distortion that’s creating both opportunities and risks for investors.

The price divergence stems from immediate behavioral changes among U.S. buyers, who are scrambling to front-load imports before tariffs take effect. This rush to beat the deadline has artificially inflated domestic prices while leaving international markets relatively stable.

The Supply Reality: America’s Copper Dependence

Understanding the investment implications requires grasping the scale of America’s copper import dependence. Nearly half of the copper consumed in the United States comes from foreign sources, creating the vulnerability that Trump’s policy aims to address.

Macquarie analysts reveal the scope of recent stockpiling behavior, estimating that copper imports totaled 881 metric tons in the first half of the year compared to an underlying requirement of around 441 metric tons. This massive discrepancy implies a 440,000-ton excess inventory build, comprised of 107,000 tons in visible Comex stocks and 333,000 tons in unreported inventory.

The United States’ underlying import demand of approximately 74,000 tons monthly, combined with this inventory overhang, suggests the country has roughly nine months to work down excess stocks. This timeline provides crucial context for investors evaluating near-term price movements.

Former U.S. Secretary of Commerce Carlos Miguel Gutierrez highlighted the strategic challenge: America’s reliance on copper imports represents a “vulnerability, but [the U.S. doesn’t] have the capacity right now to offset imports.” He anticipates both copper shortages and price increases as companies begin investing in production capacity.

The Long-Term Infrastructure Challenge

The timeline for addressing America’s copper dependence reveals why this tariff policy creates such complex investment dynamics. Sabrin Chowdhury, head of commodities research at BMI, estimates the U.S. would need 20 to 30 years to build significant copper production capacity, noting that “it takes 10 years just to explore for copper.”

This extended development timeline means the tariff’s protective benefits for domestic producers will persist far longer than typical trade policy measures. For investors, this suggests sustained structural changes in U.S. copper markets rather than temporary disruption.

The strategic importance of copper cannot be overstated. Trump noted in his Truth Social announcement that copper is the “second most used material by the Department of Defense.” Beyond defense applications, copper serves as a critical input in semiconductors, aircraft, data centers, lithium-ion batteries, and electric vehicles – all growth sectors driving increasing demand.

Wall Street’s Split Verdict: Caution vs. Opportunity

Investment professionals are sharply divided on how to approach the copper market disruption, with respected managers offering contrasting strategies based on different risk assessments.

The Cautious Approach: Volatility Concerns

Alonso Munoz, chief investment officer and founding partner at Hamilton Capital Partners, advocates staying clear of copper investments in the short term due to “potential for significant volatility.”

His concern centers on policy uncertainty: “The price of copper spiked after Trump spoke about the tariffs to his cabinet, and that gives us some caution that if the administration changes their mind, that could instantly cause prices to retreat.”

Munoz expects U.S. prices to remain elevated near-term, benefiting domestic producers through improved margins. However, he warns this will ultimately translate to higher costs for products containing copper, including data center wiring, power grid infrastructure, and electric vehicle motors.

Looking ahead, Munoz projects copper prices settling around $4.90 to $5 per ton – representing a 13% decline from current levels – despite strong demand from the green energy transition. He cautions that “short-term price spikes of 10-20% doesn’t necessarily mean it would continue,” warning that policy changes or supply-demand rebalancing could cause significant price retreats.

The Bullish Case: Undervalued Strategic Asset

Will McDonough, CEO of merchant bank Corestone Capital, presents a contrasting investment thesis, viewing copper as an undervalued asset given its expanding use cases.

“People underappreciate the volume of copper necessary for intermittent battery supplies, like solar and wind, electric vehicles or even the adoption of artificial intelligence and data centers,” McDonough argues.

His investment approach involves direct positions in copper futures, reflecting confidence in long-term demand fundamentals. McDonough attributes Trump’s copper focus to recognition that “China and unfriendly foreign powers have hoarded a lot of copper supply,” with current price jumps reflecting market awareness that “supply is concentrated.”

China’s dominance in copper markets supports this view. The country produced 1,800 metric tons of copper in 2024 while becoming the top importer of copper ore and unrefined copper, accounting for roughly 60% of total imports in 2023 compared to just 17% in 2013.

Despite his bullish outlook, McDonough acknowledges current prices may reflect some “overreaction to the tariffs.” He expects short-term corrections to “high fours or low fives” but maintains that buying copper around $5 per pound would represent “good value” over a multi-year horizon.

Market Structure and Arbitrage Dynamics

Citi Investment Research provides additional perspective on market structure implications. Their analysts expect copper prices outside the U.S. to decline to $8,800 per ton within three months, while projecting the Comex-LME arbitrage will be heavily discounted at 50%.

This discount expectation reflects both the significant U.S. inventory build and the likelihood that major copper exporters will negotiate partial exemptions at reduced tariff rates. For sophisticated investors, these arbitrage dynamics present potential opportunities, though they require careful navigation of both market and political risks.

Investment Strategy Considerations

The copper tariff situation creates several distinct investment approaches, each suited to different risk tolerances and time horizons:

Domestic Producer Exposure: U.S. copper mining companies stand to benefit from sustained price premiums and import protection. However, investors must evaluate production capacity constraints and expansion timelines.

Supply Chain Impact Assessment: Companies heavily reliant on copper inputs face margin pressure from higher material costs. This creates both risks for copper-intensive manufacturers and opportunities for companies with effective hedging strategies.

International Market Positioning: The price divergence between U.S. and global markets may create opportunities in international copper investments, particularly if U.S. inventory overhangs pressure domestic prices while global demand remains steady.

Long-Term Infrastructure Plays: The 20-30 year timeline for developing U.S. copper production capacity suggests sustained investment opportunities in domestic mining infrastructure and exploration companies.

Risk Factors and Uncertainties

Several key uncertainties complicate investment decision-making in the current environment:

Policy Durability: The tariff policy’s longevity depends on political stability and effectiveness in achieving strategic objectives. Policy reversals could quickly eliminate price premiums.

Inventory Dynamics: The substantial inventory overhang in U.S. markets could pressure prices once front-loading effects subside, particularly if demand growth disappoints.

International Retaliation: Trade partner responses could affect global copper flows and pricing relationships in unpredictable ways.

Demand Evolution: Green energy transition timelines and artificial intelligence infrastructure buildouts will significantly influence long-term copper demand growth.

The copper tariff represents a fundamental shift in U.S. trade policy toward strategic materials, creating both unprecedented opportunities and substantial risks for investors. Success will likely depend on careful analysis of inventory cycles, policy durability, and demand fundamentals rather than simply betting on continued price premiums.

As this market disruption unfolds, investors face the challenge of distinguishing between temporary arbitrage opportunities and structural changes that will reshape copper markets for decades to come.

The Insider Edge: Three High-Potential Stocks for This Week

Market noise is relentless. Financial headlines scream about the same handful of stocks while important opportunities—the kind that can meaningfully impact your portfolio—often fly completely under the radar.

That’s exactly why we publish this watchlist each week.

While most investors are distracted by mainstream narratives, we’re digging through earnings transcripts, analyzing technical setups, and monitoring institutional money flows to identify companies at potential inflection points. Our focus isn’t on what’s already priced in, but rather on what the market hasn’t fully appreciated yet.

Each week, we spotlight three stocks that merit your attention. We focus on opportunities where timing, valuation, and catalysts align to create potentially favorable entry points.

Our rigorous analysis goes beyond surface-level metrics to identify opportunities that most retail investors don’t have time to uncover. Each pick comes with clear reasoning, specific triggers to watch for, and a compelling risk-reward profile designed to help you make more informed investment decisions.

Here’s what caught our eye this week:

TJX Companies (TJX)

TJX Companies represents a compelling retail opportunity positioned to benefit from shifting consumer spending patterns as Americans increasingly seek value in their shopping habits. The company operates the T.J. Maxx brand along with HomeGoods, Marshalls, and the fast-growing outdoor retailer Sierra under CEO Ernie Herrman, who has been with the company since 1989 and running it as chief executive since 2016. What makes TJX particularly attractive is its “treasure hunt” retail model that delivers value through discounts of 20% to 60% off comparable items at full-price department or specialty stores, positioning the company perfectly as a recent Wall Street Journal headline proclaimed “American Consumers Are Getting Thrifty Again.”

The company’s off-price retail model creates sustainable competitive advantages by purchasing surplus inventory, overstock, canceled orders, and end-of-season merchandise directly from brand manufacturers and department stores. By avoiding costs associated with in-house design, seasonal planning, and large-scale marketing, TJX passes savings directly to consumers who still want quality goods for vacation or back-to-school shopping but at discounted prices. This strategy has proven remarkably resilient, with TJX growing net income by an 8% compounded annual growth rate from 2019 through today despite navigating a pandemic, spending boom and slowdown, supply chain issues, and trade disruptions.

TJX’s management demonstrates exceptional confidence in their competitive positioning during uncertain economic times. CEO Herrman emphasized in the company’s last earnings call that they are “convinced that we will have an opportunity to gain market share if more consumers seek out value in the current environment” while maintaining that their “commitment to our shoppers, great value on every item every day will continue to resonate with consumers and drive more shoppers to our stores.” The company’s global infrastructure includes over 1,300 buyers sourcing goods from more than 21,000 vendors across 100+ countries, providing significant diversification and sourcing flexibility. Management maintained full-year guidance for comparable sales, profit margins, and earnings per share for 2025, demonstrating confidence in their execution capabilities during challenging market conditions.

Coca-Cola (KO)

Coca-Cola presents an attractive growth opportunity trading at reasonable valuations while delivering solid operational performance in a challenging consumer environment. Trading at around $70.34 per share with a $303 billion market capitalization, the beverage giant offers a nearly 3% dividend yield that’s well above the S&P 500’s 1.2% yield, backed by more than six decades of consecutive annual dividend increases that qualify it as a Dividend King. What makes Coca-Cola particularly compelling is its combination of strong recent performance—with Q2 organic sales advancing 5%, more than twice the pace of competitor PepsiCo—and reasonable valuation metrics, as the stock’s price-to-sales, price-to-earnings, and price-to-book ratios all trade near or below their five-year averages.

The company’s competitive positioning reflects its status as one of the most important beverage companies globally, with industry-leading distribution, marketing, and research-and-development capabilities. Coca-Cola’s namesake brand ranks among the best-known brands on Earth, while the company maintains the financial strength to act as an industry consolidator by acquiring up-and-coming competitors to expand its brand portfolio. This market leadership has enabled consistent performance even as the broader consumer staples sector faces headwinds from shifts toward healthier products and more stringent regulatory oversight.

Recent business performance demonstrates management’s ability to execute effectively despite sector challenges. In the second quarter, Coca-Cola updated its full-year earnings guidance upward from growth of 2% to 3% to approximately 3%, indicating the business is performing at the high end of company expectations. While peer PepsiCo trades at more attractive valuations, this discount reflects weaker business performance rather than superior value. For investors seeking exposure to a proven growth company with defensive characteristics, reliable dividend income, and reasonable valuations, Coca-Cola offers an attractive combination of quality, yield, and growth potential that positions it well for long-term wealth creation.

Upstart Holdings (UPST)

Upstart Holdings presents a high-conviction fintech opportunity following a post-earnings sell-off that created an attractive entry point despite the company delivering exceptionally strong Q2 results. Trading at around $68.83 per share with a $7 billion market capitalization, the AI-powered lending platform dramatically exceeded expectations with earnings per share of $0.05 versus analyst estimates calling for a $0.10 loss, while revenue of $257 million crushed the $225.4 million consensus estimate. What makes this selloff particularly compelling is that Upstart achieved its first quarter of profitability in years with revenue up roughly 101% year-over-year and loans originated surging 159% to 372,599, yet the stock remains down approximately 83% from its all-time high.

The company’s artificial intelligence lending platform demonstrated remarkable momentum despite challenging macroeconomic conditions, with overall profitability achieved despite a $4.5 million operating loss that represented significant improvement from last year’s $55.5 million operating loss. Upstart’s technology-driven approach to credit assessment has enabled it to maintain a 97.38% gross margin while scaling operations efficiently. The disconnect between strong operational performance and stock price reaction reflects investor concerns about management commentary regarding inflation risks and increasing competitive intensity in core service markets.

However, the long-term investment thesis remains compelling based on fundamental business trends and potential macroeconomic tailwinds. Management guidance calling for sales to increase roughly 66% annually this year suggests continued strong momentum even accounting for deceleration from Q2’s exceptional growth rates. The near-term macroeconomic picture presents mixed signals with labor market weakness potentially offset by expectations for substantial Federal Reserve rate cuts at the September meeting, which could benefit lending-focused businesses. For growth investors willing to accept volatility in exchange for exposure to AI-driven financial services innovation, Upstart’s combination of technological differentiation, strong recent results, and compressed valuation following the post-earnings decline creates an asymmetric risk-reward opportunity in the rapidly evolving fintech sector.

The Exit Strategy: Stocks Showing Critical Warning Signs

August 9, 2025

Every successful investor knows a painful truth: knowing when to sell is often more critical than knowing what to buy.

While financial media overwhelmingly focuses on buying opportunities, our research consistently identifies companies facing significant headwinds that merit serious consideration for selling. These aren’t just stocks underperforming the market; they’re businesses confronting structural challenges, deteriorating fundamentals, or carrying valuations disconnected from financial reality.

What you won’t find here: reactionary calls based on short-term price movements or headline volatility. Each company on this list has been thoroughly analyzed across multiple metrics that historically precede substantial declines.

Smart investors understand that portfolio management requires both addition and subtraction. Sometimes the best investment decision is to redeploy capital away from troubling positions before problems fully materialize in the share price.

This week’s watchlist highlights stocks showing critical weaknesses that demand immediate attention:

Hims & Hers Health (HIMS)

Hims & Hers Health faces an existential legal threat that could destroy the core growth engine driving its impressive 73% revenue increase to $500 million in Q2 2025. The telehealth platform’s 17% weekly decline reflects growing investor recognition that the company is “blatantly selling patented weight loss drugs” in direct violation of intellectual property laws, creating potential liability that could dwarf its $12 billion market capitalization. While the FDA shortage loophole previously allowed sales of compounded weight loss medications, continuing these sales after the shortage ended places the company in direct legal jeopardy with pharmaceutical giant Novo Nordisk.

The fundamental issue isn’t just the current lawsuit but the reckless disregard for intellectual property law that management has demonstrated in pursuit of growth. Weight loss medications have become a significant revenue driver contributing to the 30% growth in subscribers and 30% increase in spend per active subscriber, making this legal battle potentially catastrophic for future financial performance. The company’s formerly favorable partnership with Novo Nordisk deteriorated specifically because of “disagreements over Hims & Hers selling knockoffs of its weight loss drug formula,” suggesting management knowingly chose short-term profits over long-term legal compliance.

At $51.81 with a 67.11% gross margin that appears strong on the surface, Hims & Hers trades on the assumption that its rapid growth trajectory can continue indefinitely. However, the legal ramifications of selling patented drugs without authorization could result in massive damages, injunctive relief forcing business model changes, and potential criminal liability for willful patent infringement. While the stock has generated exceptional returns with 400% gains over five years, the current legal exposure represents an unquantifiable risk that prudent investors cannot reasonably assess. For shareholders, the combination of management’s apparent disregard for intellectual property law and the potential for business-ending damages creates a compelling case for exit until the dispute is resolved and new compliance frameworks are established.

Camtek (CAMT)

Camtek demonstrates how even strong fundamental performance can trigger significant selling when growth trajectories fail to meet elevated investor expectations in hot sectors like AI-adjacent semiconductors. The inspection equipment manufacturer’s nearly 15% weekly decline despite achieving record revenue of $123 million (20% year-over-year growth) and 19% profit growth to $39 million reveals how AI-related stocks face heightened scrutiny when results merely meet rather than exceed expectations. The company’s positioning in advanced packaging for AI components should theoretically benefit from increased computing power requirements, yet investors appear concerned about the sustainability of current growth rates.

The technical warning signals are particularly concerning given Camtek’s exposure to semiconductor industry cyclicality. Third-quarter guidance of $125 million represents 11% year-over-year growth, a notable deceleration from Q2’s 20% pace that suggests demand patterns may be normalizing after the AI-driven surge. This guidance disappointment is especially problematic for a stock trading at premium valuations within the semiconductor equipment space, where investors have been willing to pay elevated multiples based on assumptions of sustained AI-driven demand acceleration.

At $83.02 with a market capitalization of $4 billion and a 50.29% gross margin, Camtek appears technically sound but potentially overvalued relative to its cyclical industry positioning. The trading volume patterns and technical breakdown from recent highs near $110 suggest institutional investors are taking profits after the stock’s substantial run-up. For investors seeking semiconductor exposure, Camtek’s combination of growth deceleration, premium valuation, and cyclical industry dynamics creates risk that the current correction may have further to run before finding sustainable support levels.

Snap (SNAP)

Snap exemplifies the persistent challenges facing social media companies attempting to achieve sustainable profitability despite user growth and revenue expansion. The platform’s 17% weekly decline following second-quarter results highlights how investors have lost patience with companies that continue burning cash despite years of scale building. While revenue grew 9% year-over-year to $1.35 billion and daily active users increased by the same percentage to 469 million, the company’s net loss actually deepened to $263 million from $249 million the previous year, demonstrating inability to convert growth into profitability.

Most concerning is the stagnation in average revenue per user (ARPU), which increased by just $0.01 to $2.87, suggesting Snap is struggling to monetize its user base effectively despite platform improvements and advertising tool enhancements. This ARPU weakness indicates fundamental challenges in competing for advertising dollars against platforms like TikTok, Instagram, and YouTube that offer superior targeting capabilities and audience engagement metrics. The decision to raise $550 million through senior notes at nearly 6.88% interest (upsized from $500 million) signals management’s recognition that the path to profitability remains unclear and expensive.

At $7.42 with a market capitalization of $12 billion, Snap trades at substantial multiples to revenue despite persistent losses and increasingly expensive capital requirements. The company’s 51.14% gross margin provides some operational leverage potential, but consistent inability to control overall expenses suggests systemic rather than temporary profitability challenges. With extraordinary trading volume of 49.9 million shares versus the 38.4 million average, institutional selling appears to be accelerating as investors lose confidence in the company’s ability to achieve sustainable profits. For investors seeking social media exposure, Snap’s combination of deepening losses, stagnant monetization, and expensive debt financing suggests considering alternatives with clearer paths to profitability or more defensive market positions in the evolving social media landscape.

Bottom Line

This week’s featured companies illustrate how different types of business risks can overwhelm otherwise positive operational metrics and trigger significant selling pressure. Hims & Hers faces potentially catastrophic legal liability from patent infringement, Camtek confronts growth deceleration expectations in a cyclical industry, and Snap struggles with persistent profitability challenges despite user growth. In each case, fundamental concerns about business sustainability, legal compliance, or competitive positioning have created situations where strong revenue growth or market position advantages cannot offset underlying vulnerabilities. For prudent investors, these examples highlight the importance of recognizing when external risks, execution challenges, or industry dynamics create asymmetric downside potential that outweighs apparent operational strengths.

Disclaimer: This analysis represents the opinions of the author and should not be considered investment advice. Always conduct your own research before making investment decisions.

Stock Split Mania: Why Smart Investors Should Look Beyond the Headlines

Stock splits have become Wall Street’s latest obsession, generating headlines and driving retail investor excitement across social media platforms. But as we’ve witnessed throughout market history, when any investment theme captures mainstream attention, it’s time for serious investors to separate substance from speculation.

The current split frenzy offers a perfect case study in why fundamental analysis trumps financial engineering every time. Recent market action has produced both compelling investment opportunities and dangerous traps, often within the same corporate action category. For investors building long-term wealth, understanding this distinction makes the difference between substantial gains and devastating losses.

The Fundamentals Haven’t Changed

Despite the excitement surrounding stock splits, the mathematical reality remains unchanged: these corporate actions don’t alter a company’s market capitalization, earnings power, or competitive position. A $100 stock becoming a $10 stock through a 10-for-1 split creates no additional value – it simply rearranges the numbers on your brokerage statement.

This basic truth exposes the fundamental flaw in split-focused investing strategies. When investors prioritize corporate actions over business quality, they’re essentially betting on market psychology rather than economic reality. While such strategies can work during momentum-driven periods, they inevitably end poorly when sentiment shifts.

The recent performance of various split stocks illustrates this principle perfectly. Companies with strong underlying businesses have used splits as opportunities to attract new investors to already-successful stories. Meanwhile, speculative companies have leveraged split excitement to paper over fundamental weaknesses that remain unchanged by the corporate action itself.

The Tale of Two Splits: Quality vs. Speculation

O’Reilly Automotive provides a textbook example of how established companies can benefit from split-generated attention. The auto parts retailer’s 15-for-1 split in June reduced its stock price from nearly $1,400 to around $90, making shares more accessible to retail investors.

But here’s what matters: O’Reilly earned the right to trade at premium valuations through decades of operational excellence. The company has gained almost 62,000% since its public debut – not through financial engineering, but by building an unassailable competitive position in automotive aftermarket sales.

The company’s hub-and-spoke distribution model ensures same-day or overnight delivery of more than 153,000 stock keeping units to outlet stores. This operational infrastructure creates genuine competitive advantages that translate into pricing power and market share gains.

Perhaps more impressively, O’Reilly has deployed capital with exceptional discipline, spending $26.59 billion since 2011 to retire nearly 60% of outstanding shares. This aggressive buyback program, combined with growing earnings, has generated substantial per-share value creation that exists independently of any stock split.

In stark contrast, Regencell Bioscience Holdings represents everything wrong with speculation masquerading as investment. The clinical-stage company completed a 38-for-1 split following a 60,000% rally that defied any rational valuation framework.

Regencell generates no revenue, operates under going concern warnings, and faces a “mile long” list of risk factors including admissions that it has never completed large-scale clinical trials. Yet momentum traders pushed its market capitalization above $7 billion during the peak excitement.

The fundamental difference is obvious: O’Reilly split its stock because sustained business success made shares expensive for retail investors. Regencell split its stock because speculative fervor created an unsustainable price that bore no relationship to underlying business value.

The Quantum Computing Question

Rigetti Computing presents a more nuanced situation that highlights why investors must think beyond simple split speculation. The quantum computing company has gained over 1,370% in the past year as investors embrace potentially revolutionary technology.

Unlike Regencell, Rigetti operates in a space with genuine transformative potential. Quantum computers using qubits instead of traditional bits could solve complex problems in molecular simulation, climate solutions, and machine learning that remain impossible with current technology.

The company has achieved measurable technical progress, with its 36-qubit system recently achieving twice-lower gate error rates – its best performance yet. These aren’t marketing promises but quantifiable improvements in a rapidly evolving field.

However, Rigetti also illustrates why technological promise alone doesn’t justify investment. The company generated only $1.5 million in Q1 2025 revenue, highlighting the vast gap between potential applications and commercial reality. While shareholders approved a reverse split in 2024 (never executed due to price recovery), the underlying business remains years from meaningful revenue generation.

For investors, Rigetti represents the classic early-stage technology dilemma: genuine innovation potential coupled with extreme execution risk and uncertain timelines. Unlike established companies splitting shares after proven success, quantum computing stocks split speculation on unproven future outcomes.

Market Structure and Investor Behavior

The current split environment reveals important insights about market structure and investor psychology. When retail investors focus disproportionately on stock splits, it often signals broader market dynamics worth understanding.

Forward splits typically indicate business success, as companies usually split shares only after substantial price appreciation. This creates a survivorship bias where split announcements generate positive investor response regardless of underlying business quality.

However, this psychological response creates arbitrage opportunities for investors willing to look beyond corporate actions. Companies splitting shares after genuine business success (like O’Reilly) often continue outperforming, while those splitting shares during speculative bubbles (like Regencell) typically collapse once momentum fades.

The key insight is that splits represent symptoms, not causes, of investment returns. Successful companies split shares because they’ve created substantial value through operational excellence. Unsuccessful companies split shares to capitalize on market enthusiasm that exists independently of business performance.

Investment Implications Going Forward

For serious investors, the current split environment offers several actionable insights:

Focus on business quality over corporate actions. Companies announcing splits deserve the same fundamental analysis as any other investment. Strong businesses remain strong after splits; weak businesses remain weak regardless of share price manipulation.

Understand the motivation. Forward splits by established companies with long track records typically indicate continued confidence in business prospects. Splits by speculative companies often represent attempts to capitalize on momentum rather than signal fundamental strength.

Consider market timing. Split announcements often coincide with peak enthusiasm for particular companies or sectors. This can create both opportunities (for quality companies) and traps (for speculative plays).

Maintain perspective on valuations. Splits don’t change fundamental valuation metrics – they only alter the presentation. A company trading at 50 times earnings continues trading at 50 times earnings after any split ratio.

Recognize the psychological component. Retail investor excitement around splits can create short-term price movements that deviate from fundamental value. These deviations eventually correct, creating opportunities for patient investors.

The Bigger Picture

Stock split mania represents a microcosm of broader market dynamics that separate successful long-term investors from those chasing short-term excitement. When any investment theme generates mainstream enthusiasm, it attracts both legitimate opportunities and speculative excess.

The challenge for individual investors lies in distinguishing between companies using splits to make genuinely successful businesses more accessible and those leveraging split psychology to mask fundamental weaknesses. This distinction requires the same analytical framework applied to any investment decision: understanding the underlying business, evaluating competitive positions, and assessing management’s track record of value creation.

Ultimately, stock splits will continue generating headlines and retail investor excitement. But for investors focused on building long-term wealth, the splits themselves matter far less than the business quality of companies announcing them. In a market environment where financial engineering often receives more attention than operational excellence, this focus on fundamentals provides the clearest path to sustainable investment success.

The companies that deserve investment attention are those that would merit consideration even without splitting their shares. Everything else is just noise.

The Insider Edge: Three High-Potential Stocks for This Week

Market noise is relentless. Financial headlines scream about the same handful of stocks while important opportunities—the kind that can meaningfully impact your portfolio—often fly completely under the radar.

That’s exactly why we publish this watchlist each week.

While most investors are distracted by mainstream narratives, we’re digging through earnings transcripts, analyzing technical setups, and monitoring institutional money flows to identify companies at potential inflection points. Our focus isn’t on what’s already priced in, but rather on what the market hasn’t fully appreciated yet.

Each week, we spotlight three stocks that merit your attention. We focus on opportunities where timing, valuation, and catalysts align to create potentially favorable entry points.

Our rigorous analysis goes beyond surface-level metrics to identify opportunities that most retail investors don’t have time to uncover. Each pick comes with clear reasoning, specific triggers to watch for, and a compelling risk-reward profile designed to help you make more informed investment decisions.

Here’s what caught our eye this week:

Intuitive Surgical (ISRG)

Intuitive Surgical represents a compelling growth opportunity in the expanding robotic surgery market, maintaining its pioneering leadership position through continuous innovation and a robust recurring revenue model. Trading at around $483.30 per share with a $173 billion market capitalization, the medical technology leader has built an impressive moat around its da Vinci surgical system, which has been transforming minimally invasive procedures for over two decades. What makes Intuitive Surgical particularly attractive is its diversified revenue stream structure, where the most significant portion comes not from the million-dollar-plus system sales, but from the recurring instruments and accessories business that generates revenue with each surgery performed using specialized single-use tools.

The company’s financial performance demonstrates the power of its razor-and-blade business model combined with expanding market penetration. Revenue growth for the first half of 2025 totaled $4.69 billion, representing a healthy 20% increase from the $3.9 billion reported in the first half of 2024. Net income for the same period reached $1.4 billion, up 27% year-over-year, while the newly launched da Vinci 5 platform has already achieved significant adoption with over 100,000 procedures performed since its initial U.S. approval in early 2024. The system is now broadly available in the U.S. with limited launches beginning in Europe and Japan following regulatory clearances.

The da Vinci system’s competitive advantages extend far beyond traditional surgical tools through enhanced precision and improved patient outcomes. These robotic systems provide surgeons with enhanced dexterity, precision, and control during minimally invasive procedures including thoracic, gynecologic, and general surgeries. The systems allow for a wider range of motion than the human hand and wrist, translating surgeon movements into precise instrument actions within a patient’s body, particularly helpful for complex procedures in confined spaces while improving surgery outcomes, shortening recovery time, and reducing adverse complications. With the average consensus 12-month price target from analysts suggesting approximately 20% potential upside from current share prices, Intuitive Surgical offers investors exposure to a healthcare technology leader benefiting from both technological innovation and the structural shift toward minimally invasive surgical procedures.

Generac Holdings (GNRC)

Generac Holdings has emerged as Bank of America’s latest “under-the-radar AI data center play” following the company’s strategic entry into the backup generator market for artificial intelligence infrastructure. Bank of America raised its stock price target to $221, indicating 21% upside from the previous close of $181, while analyst Dimple Gosai called the data center market “the most needle-moving opportunity in decades” for Generac management. What makes Generac particularly compelling is its positioning to address a critical supply shortage, with the tech sector facing a backup generator deficit of 5,000 units in 2026 as companies rapidly build out data centers, making this one of the top two bottlenecks for the industry after transformers.

The company has already booked a backlog of $150 million with shipments ramping up in the second half of 2025, while engaging in discussions with customers planning out to 2029. Bank of America forecasts $350 million of data center revenue for Generac in 2026, with sales ramping to $500 million in 2027 before hitting capacity. This growth trajectory reflects the massive infrastructure investments required to support data center buildout, where tech companies are urgently working to fill the gap in backup generator supply, benefiting Generac according to the analyst.

Generac’s strategic positioning comes at a critical time when data centers require sophisticated backup power solutions. The company’s advanced battery technology has provided performance advantages that have outweighed concerns, according to analyst commentary. Strategic manufacturing diversification provides additional competitive advantages and risk mitigation, with manufacturing capacity offering pathways to address supply chain concerns while serving customers who prioritize reliable backup power systems. For growth investors seeking exposure to the intersection of defense spending, technology adoption, and advanced power systems, Generac offers a high-reward opportunity to participate in what appears to be the early stages of significant industry transformation driven by data center infrastructure demands.

CoreWeave (CRWV)

CoreWeave presents a high-conviction play on artificial intelligence cloud computing following Citi’s recent upgrade to “Buy” from “Neutral” with a $160 price target that implies 55% upside from recent levels. Despite more than doubling since its IPO in late March, the stock has tumbled nearly 37% over the past month due to investor skepticism about the company’s $9 billion acquisition of Core Scientific, creating what analyst Tyler Radke views as an attractive re-entry opportunity. What makes CoreWeave particularly compelling is its deep partnership with Microsoft, which accounted for 72% of Q1 2025 revenue, positioning the company to benefit directly from the tech giant’s strong quarterly figures that signal AI demand remains robust.

Citi’s upgrade reflects increased confidence in the durability of AI demand following Microsoft’s stronger-than-expected performance, with Radke writing that he comes away “with a much stronger fundamental view on the demand picture highlighted by MSFT beating/raising on Azure and raising capex with upside to finance leases.” The analyst noted greater confidence about the durability of AI demand and CoreWeave’s position in the market, though he still holds some concerns around customer concentration and the company’s ability to move up the stack. CoreWeave shares popped more than 13% in premarket trading following the upgrade, while Microsoft traded 8% higher.

However, investors must acknowledge the significant risks and mixed Wall Street sentiment surrounding CoreWeave’s investment thesis. Radke’s upgrade puts him in the minority on Wall Street, with LSEG data showing that 17 of 24 analysts covering the stock rate it a hold, while three others have an underperform rating. Just four analysts rate CoreWeave as a buy or strong buy. The company operates in the artificial intelligence cloud computing space, where customer concentration and competitive positioning remain key concerns for analysts. For growth investors willing to accept elevated risk in exchange for exposure to the AI infrastructure revolution, CoreWeave offers significant upside potential through its strategic positioning with Microsoft and cloud computing capabilities, provided position sizing remains appropriate given the company’s volatility and concentrated customer base.

The Exit Strategy: Stocks Showing Critical Warning Signs

August 2, 2025

Every successful investor knows a painful truth: knowing when to sell is often more critical than knowing what to buy.

While financial media overwhelmingly focuses on buying opportunities, our research consistently identifies companies facing significant headwinds that merit serious consideration for selling. These aren’t just stocks underperforming the market; they’re businesses confronting structural challenges, deteriorating fundamentals, or carrying valuations disconnected from financial reality.

What you won’t find here: reactionary calls based on short-term price movements or headline volatility. Each company on this list has been thoroughly analyzed across multiple metrics that historically precede substantial declines.

Smart investors understand that portfolio management requires both addition and subtraction. Sometimes the best investment decision is to redeploy capital away from troubling positions before problems fully materialize in the share price.

This week’s watchlist highlights stocks showing critical weaknesses that demand immediate attention:

Lumen Technologies (LUMN)

Lumen Technologies exemplifies how debt-burdened companies pursuing turnaround strategies can face extended periods of value destruction even when achieving modest operational improvements. The network infrastructure company’s 16.52% plunge following second-quarter results reveals the market’s impatience with “shrink to eventually grow” strategies when time is running short. Despite technically beating earnings expectations with a smaller adjusted loss of $0.03 per share versus $0.13 the previous year, the 5.4% revenue decline to $3.09 billion missed analyst expectations and highlighted the fundamental challenge facing management’s transformation efforts.

The company’s enterprise business segmentation strategy appears increasingly problematic, with the “Nurture” segment declining 18% year-over-year despite being positioned as a stable middle-growth category between the growing and declining segments. This unexpected weakness in what should be a predictable revenue stream calls into question management’s ability to accurately forecast business trends and execute the strategic pivot to enterprise-focused services. While the “Grow” segment’s 8.5% increase and surprising 2.1% growth in the “Harvest” segment provide some encouragement, the overall trajectory remains concerning given the timeline pressures created by the company’s debt burden.

Most alarming is Lumen’s precarious financial position, with $18.3 billion in total debt representing 4.9 times adjusted EBITDA. While the planned sale of 95% of its consumer fiber business to AT&T will reduce leverage to 3.9 times, this still represents an unsustainable debt load for a company experiencing persistent revenue declines. The $500 million increase in 2025 free cash flow guidance appears misleading, as $400 million stems from a one-time tax benefit rather than operational improvements. At $3.71 with extraordinary trading volume of 44.7 million shares versus the 11.4 million average, Lumen shows classic signs of institutional abandonment. For investors seeking telecom exposure, the combination of heavy debt, revenue declines, and execution uncertainties suggests waiting for either a successful turnaround completion or debt restructuring before considering investment.

Casella Waste Systems (CWST)

Casella Waste Systems demonstrates how acquisition-driven growth strategies can mask underlying operational deterioration and create unsustainable earnings expectations. The waste management company’s 5.29% decline following earnings reflects investor disappointment with a massive bottom-line miss despite strong revenue growth. While second-quarter revenue of $465 million represented impressive 23% year-over-year growth, GAAP net income fell to just $5.2 million ($0.08 per share) from $7 million the previous year, dramatically missing analyst expectations of $0.33 per share.

The fundamental concern with Casella’s business model is the disconnect between top-line growth and profitability generation. The company completed six acquisitions in the first half of 2025, suggesting that revenue growth is largely purchased rather than organic. This acquisition-heavy strategy typically leads to margin compression and integration challenges that can persist for quarters or years. The company’s 17.79% gross margin provides limited cushion for operational inefficiencies, while the dramatic earnings miss suggests management may be struggling to effectively integrate acquired assets or accurately forecast integration costs.

Perhaps most concerning is management’s decision to lower full-year profitability guidance despite raising revenue expectations, projecting GAAP net income of just $8-18 million compared to previous guidance of $10-25 million. This revision suggests the earnings miss was not a one-time event but rather indicative of structural challenges in converting acquired revenue into profits. At $102.98 with a market capitalization of $7 billion, Casella trades at extremely high multiples to its modest profitability, creating significant downside risk if margin pressures persist. The elevated trading volume of 1.13 million shares versus the 438,000 average indicates institutional investors are reassessing positions following the guidance revision. For investors seeking exposure to the waste management sector, Casella’s combination of acquisition dependence, margin compression, and premium valuation suggests considering alternatives with more predictable organic growth and profitability conversion.

Tilray Brands (TLRY)

Tilray Brands illustrates the persistent challenges facing cannabis companies attempting to achieve sustainable profitability in an oversupplied and heavily regulated market. The company’s 16% weekly decline despite posting an unusual adjusted profit highlights how even positive developments cannot overcome fundamental sector headwinds. While Tilray achieved $20 million in adjusted net income ($0.02 per share) versus analyst expectations of a $0.02 loss, this improvement was overshadowed by declining revenue across both cannabis and beverage segments, with net revenue falling to $224.5 million from $230 million the previous year.

The most troubling aspect of Tilray’s results is the nearly $1.3 billion GAAP net loss, primarily from goodwill and intangible asset write-downs related to the 2021 Aphria merger. These massive charges reflect the industry’s dramatic valuation reset since the merger, when cannabis optimism was at its peak and acquisition prices reflected unrealistic growth expectations. The company’s cannabis revenue decline to under $68 million from nearly $72 million, combined with beverage revenue falling to $65.6 million from $76.7 million, demonstrates persistent market share erosion across core business segments.

At $0.57 per share with a market capitalization of $626 million, Tilray remains significantly overvalued relative to its financial performance and growth prospects. Even Jefferies analyst Kaumil Gajrawala’s $1.50 price target (implying 163% upside) failed to generate investor enthusiasm, suggesting the market has lost faith in cannabis sector recovery narratives. The 18.50% gross margin provides minimal operational leverage, while the company’s inability to achieve consistent revenue growth after years of market development raises questions about long-term viability. With trading volume declining to 20.5 million shares versus the 32.8 million average, even speculative interest appears to be waning. For investors still holding cannabis positions, Tilray’s combination of revenue declines, massive write-downs, and sector-wide challenges suggests the industry remains in a prolonged downturn that could last years rather than quarters.

Bottom Line

This week’s featured companies demonstrate how different types of operational challenges can create persistent headwinds regardless of management efforts or occasional positive developments. Lumen Technologies faces the dual pressures of debt service and revenue decline during a strategic transition, Casella Waste Systems struggles to convert acquisition-driven growth into sustainable profits, and Tilray Brands confronts industry-wide challenges that appear structural rather than cyclical. In each case, the market’s reaction suggests investors are losing patience with turnaround stories, acquisition strategies, and sector recovery narratives that have failed to deliver sustainable value creation. For prudent investors, these situations highlight the importance of distinguishing between temporary setbacks and fundamental business model challenges that may persist regardless of management’s best efforts.

Popular Posts

My Favorites

Three Stocks to Sell ASAP

0
The right stocks can make you rich and change your life. The wrong stocks, though… They can do a whole lot more than "underperform." If...